"In 2018, we completed our accounting for the [immediate] tax effects of the enactment of the [Tax Cuts and Jobs] Act...the total benefit was $22,211 [million]"
AT&T Inc. FY2019 Form 10-K
"Our effective tax rate for fiscal years 2020 [5.9%] and 2019 [-6.3%] was lower than the U.S. federal statutory rate of 21% due primarily to income earned in...the British Virgin Islands and Hong Kong, ... U.S. federal research tax credits, excess tax benefits related to stock-based compensation, and the...effects of the TCJA in 2019."
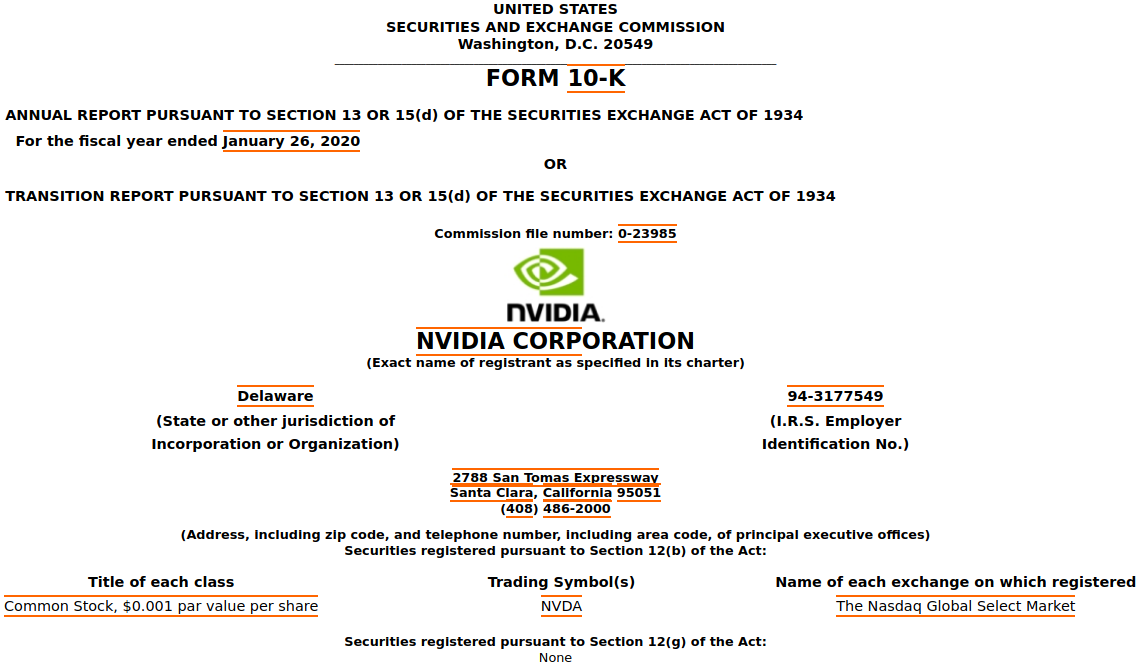
Nvidia Corporation FY2020 Form 10-K
Brief Summary
Through a manual analysis of more than 1000 Form 10-K filings and proxy statements to the Securities and Exchange Commission, we stitched together both the entire (public) tax histories and peer relationships of 57 tech, staffing, and defense companies. We show that four times as many profitable companies in our sample had (worldwide) effective tax rates less than 21% after passage of the Tax Cuts and Jobs Act (TCJA) than before.
We further provide a direct comparison of the breakdowns of the taxation rates of drone surveillance contractors ASGN (a staffing company) and Nvidia (a GPU manufacturer) which underlines ITEP's arguments that offshore tax havens, stock-based compensation and R&D tax credits are continued mechanisms for large-scale tax avoidance. Even relative to the new U.S. statutory rate of 21%: Apple is allowed to avoid provisioning roughly $2.6B per year, Microsoft $3.6B, Alphabet $3.1B, Amazon $900M, and Facebook $500M. (And relative to the pre-TCJA rate of 35%: Apple is saving $12B per year, Microsoft $10B, Alphabet $8.3B, Amazon $2.6B, and Facebook $4.0B.) One can argue these tax burdens have been shifted onto average citizens, as the median income U.S. citizen has a total federal, state, and local effective taxation rate of roughly 26%.
We also identified HPE, Broadcom, Twitter, HP, and Boeing as having each reported net tax benefits over their most recent two fiscal years -- even after adjusting for one-time TCJA impacts -- despite having earned profits. We further pointed to IBM, Netflix, Nvidia, Alphabet, Microsoft, Amazon, and Apple as particularly problematic due to the regressive nature of their high market capitalizations and low effective tax rates post-TCJA. Despite the poor optics of contractors like Genpact and Accenture domiciling in offshore tax havens such as Bermuda and Ireland, we were surprised that their effective tax rates are now substantially higher than those of namebrand tech giants.
We hope that our report can help harness some of the current scrutiny over 'Big Tech' towards their increasingly aggressive tax avoidance. The ability of tech companies to suppress anti-monopoly critique and engage in record-setting amounts of corporate lobbying is, at least partly, fueled by massive savings from sub-statutory taxation rates.
Introduction
The relationships between tech companies and defense contractors have been under increased scrutiny -- by tech workers, the Department of Defense, and political actors of all kinds -- since the introduction of the Third Offset Strategy. Privately launched in 2012 via the Strategic Capabilities Office, the Third Offset Strategy later broadened into a collective effort known as the Defense Innovation Initiative, whose mission is amplifying U.S. battle networks via machine learning and data assimilation to maintain military dominance over China and Russia despite the U.S.'s smaller number of troops. [1] At the same time, corporate influence over legislation and civil society is growing as a result of record-breaking market capitalizations, partly driven by dramatic tax cuts enacted in 2017. [2]
Through the manual analysis of more than a thousand Form 10-K filings and proxy statements to the Securities and Exchange Commision (SEC), this report attempts to provide a broad understanding of both:
- The corporate linkages between Silicon Valley and weapons manufacturers, as intermediated by consulting and staffing firms, and
- Corporate tax avoidance before and after the Tax Cuts and Jobs Act. [3]
In parallel with this report, we make each accumulated company
profile -- including additional information,
such as descriptions of executives, revenue, net income, etc. --
available through the interface at
techinquiry.org/lobbying.
Expanding Corporate Power and the Tax Cuts and Jobs Act
U.S. corporate tax rates declined in fits between 1969 and 1988 -- with the federal statutory rate starting at 52.8% and ending at 34% -- before increasing by one percent in 1993 and staying steady at 35% for a quarter of a century. [4] Yet U.S. corporations found ways of paying substantially less than the 35% statutory rate by making use of tax havens -- or base erosion and profit shifting (BEPS) -- in countries such as Ireland (as Apple, Google, Microsoft, Facebook, Dell, Oracle, Intel, Amazon, Salesforce and Accenture have), Luxembourg (as Amazon has), the Caribbean (as Nvidia, Accenture, and Genpact have), Singapore (as Broadcom has), and Hong Kong (as Nvidia has). [5]
After Barack Obama took office in 2009, he made a series of statements about his intent to close offshore tax loopholes that set off a wave of 'corporate redomiciliations' from Bermuda -- which the Stop Tax Haven Abuse Act that Obama co-sponsored in 2007 explicitly listed as a tax haven -- to Ireland. In a November 2009 advertisement to convince more U.S. companies to consider such a transition, Irish law firm William Fry listed Accenture, Ingersoll Rand, and Cooper Industries as companies publicly committed to the leap.
Obama's push to close tax havens resulted in the passage of the Foreign Account Tax Compliance Act (FATCA) in early 2010; its key provision was a requirement for Foreign Financial Institutions to report information about their U.S. account holders. Despite resulting in Israel's largest bank, Bank Hapoalim, receiving a fine of $874M over sheltering $7.6B in American assets in April of this year, a former ambassador from the Obama administration recently stated that FATCA didn't go "nearly far enough".
Then, at the end of 2017, Congress passed the Tax Cuts and Jobs Act (TCJA), which alleged that it would solve the base erosion problem through the approach long advocated by corporate lobbyists: massively slashing the U.S. statutory tax rate -- down from 35% to 21% -- in concert with penalties on offshore earnings. Perhaps predictably, companies such as Nvidia accepted the lower U.S. tax rate and worked around the penalties for offshore tax havens: after adjusting for one-time impacts of the TCJA, Nvidia's 2019 and 2020 effective tax rates were respectively 3.16% and 5.86% due to
"income earned in...the British Virgin Islands and Hong Kong, where the tax rate was lower than the U.S. federal statutory tax rates, favorable recognition of U.S. federal research tax credits, [and] excess tax benefits related to stock-based compensation."
According to an influential report from the Institute on Taxation and Economic Policy (ITEP) released in December 2019, the ability of companies to work around the offshore penalties was "by design" and:
When drafting the tax law, lawmakers could have eliminated special breaks and loopholes in the corporate tax to offset the cost of reducing the statutory rate. Instead, the new law introduced many new breaks and loopholes, though it eliminated some old ones. The unsurprising result: Profitable American corporations in 2018 collectively paid an average effective federal income tax rate of 11.3 percent on their 2018 income, barely more than half the 21 percent statutory tax rate.
It is important to note that ITEP's study zeroed in on the amount of taxes directly paid to the U.S. federal government in a particular year, rather than the more standard -- and nebulous -- world-wide 'provision' for income taxes which incorporates multi-year rollovers of 'deferred' tax assets and liabilities. (We have used the latter method in our report both because it allows us to extensively quote from the statements from companies themselves in their tax filings, and because it provides a complement to the analysis from ITEP.)
Contractors as Barriers Between Tech and Offense
The most publicized relationship between Silicon Valley and the Department of Defense -- only rivaled by the Pentagon's still-contested Joint Enterprise Defense Infrastructure cloud program -- has been the Air Force's effort to counter the high personnel costs of manually monitoring wide-area drone footage by applying recent computer vision infrastructure from prominent Silicon Valley companies (the most widely cited component has been the Joint Artificial Intelligence Center's Project Maven). [6, 7]
Like computer vision startup Clarifai, Google preferred to avoid mentioning that they subcontracted on their drone surveillance work through ECS Federal, which was acquired by publicly traded workforce augmentation company ASGN Incorporated (f.k.a. On Assignment) in 2018. And it appears to not have been reported that, during a 2018 earnings call, ASGN disclosed that "Google, Amazon, Microsoft [and] 13 other Silicon Valley companies" were developing algorithms for "wide-area motion imagery as well as [Infrared] and [Synthetic Aperture Radar] technologies" as "subcontractors" on "Project APOLLO". [8]
(See our previous publication, Reports of a Silicon Valley/Military Divide have been Greatly Exaggerated, for a deep dive into public contracting records and Freedom of Information requests from such subcontracting relationships.)
ASGN is but one of many contractors that major tech companies use as financial, legal, and/or public relations shields for controversial projects. A series of exposés at The Verge documented the horrific working conditions of content moderators for Facebook (contracted through Cognizant in Tampa and Accenture in Austin) and Google (contracted through Accenture in Austin). And, since 2018, The Times of Ireland and Reuters have reported on the low wages of contractors for Google Maps (employed through Cognizant in Dublin) and Facebook (employed through Cpl Resources subsidiary Covalen Managed Solutions in Dublin and one of General Electric's spin-offs, Genpact, in Hyderabad). [9] Beyond underpaying their workers, both Genpact and Accenture have domiciled in Bermuda for tax avoidance purposes, though Accenture moved its headquarters to Ireland in 2009 in response to an Obama-era corporate tax changes. [10]
Major tech companies having close relationships with national security staffing contractors such as ASGN might seem unrelated to shifting content moderation to abusive companies such as Accenture and Genpact, but the two communities are interconnected. For example, Accenture is a major contractor with both the U.S. military and federal law enforcement agencies: it has a Border Services division and its federal services subsidiary was infamously kicked off a staffing contract with Customs and Border Protection for underperformance. Accenture's own statement to the Securities and Exchange Commission (SEC) describes its peers as: weapons manufacturers, such as General Dynamics and Lockheed Martin, other systems integrators, such as Cognizant and IBM, and defense-connected tech companies, such as Oracle and Cisco. (And each mentioned company reciprocated by listing Accenture as a peer).
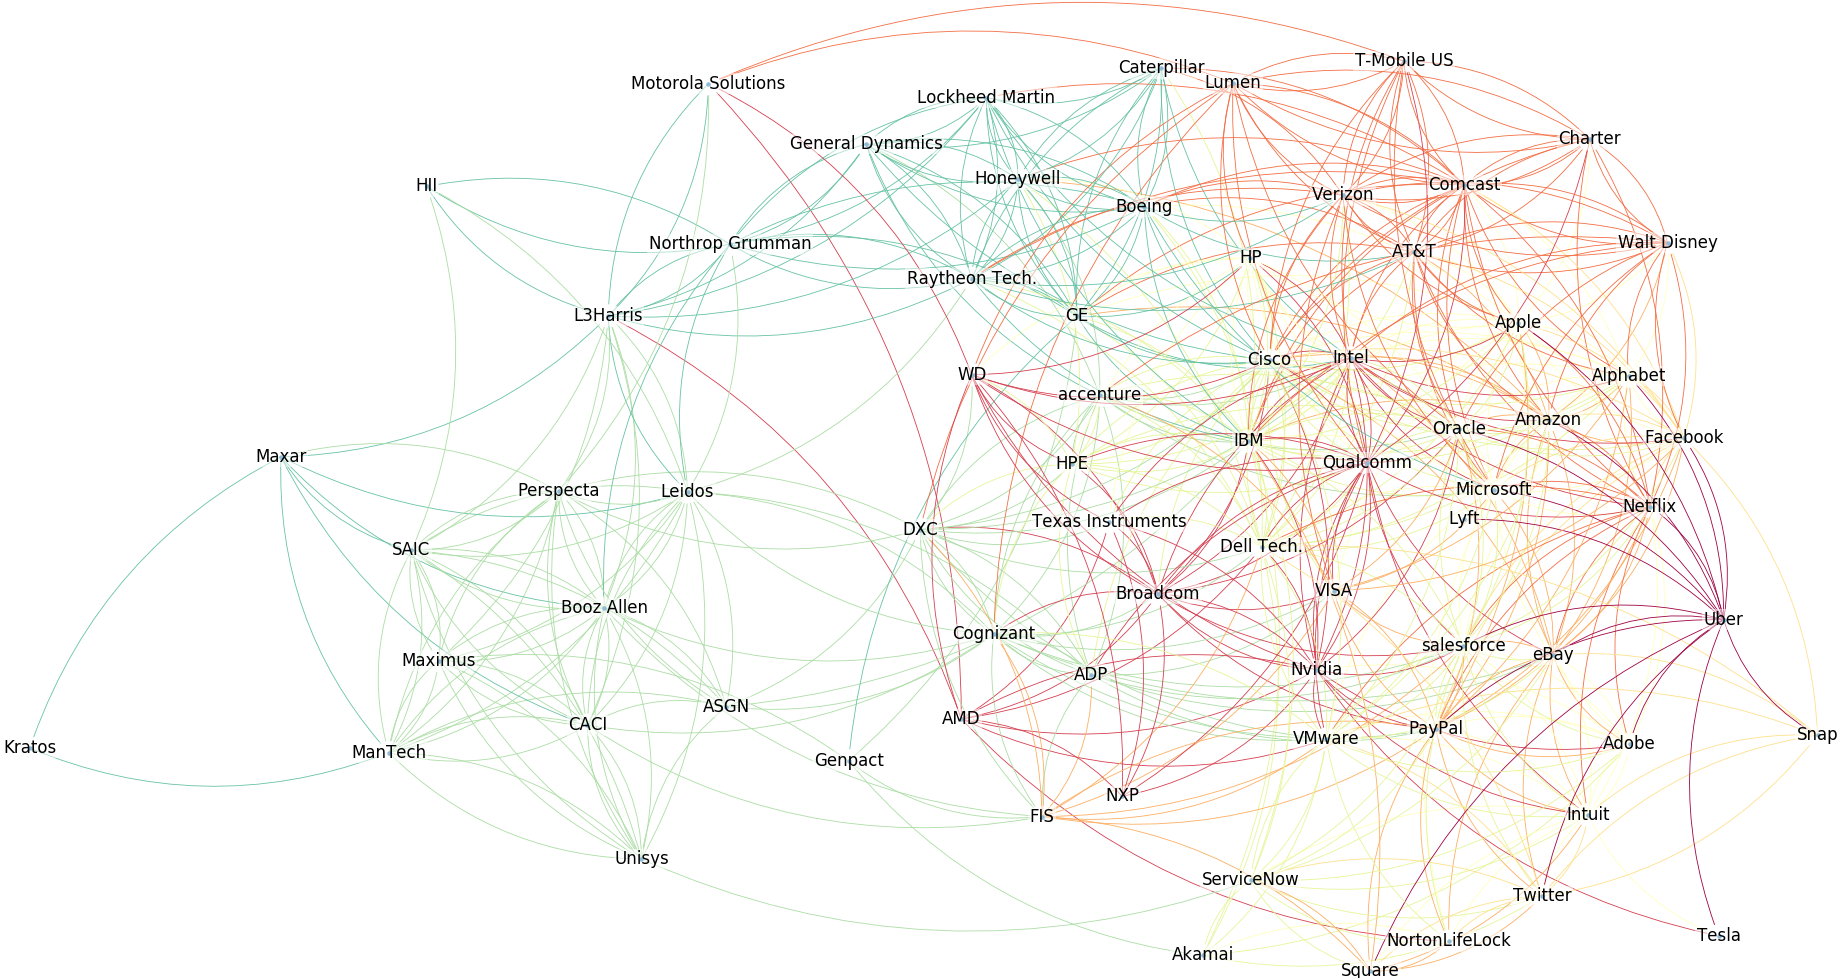
Inspecting the Peer Graph
Due to the, perhaps overwhelming, number of companies involved in this report, we made frequent use of a set of rough sectoral categorizations described in detail in the appendix. One can get a sense for the cohesiveness and interconnectedness of each of our sectoral divisions through the executive peer groups defined by each company within their SEC filings (using the methodology described in the appendix). We provide a visualization of said peering relationships, color-coded by sector, within Figure 2.
Under the 'by Sector' ordering, companies are sorted first by their sector, and then secondarily by the number of companies within their sector that considered them a peer. The result is that the diagonal of the figure consists of a sequence of nine partially-filled squares of different colors, with the rows of each such square block representing the portion of a company's peer group lying within its own sector. [12]
For example, the fourth row of the second square along the diagonal provides CACI's self-defined peers within our set of representatives for its own sector (consulting): Leidos, Booz Allen, SAIC, CACI, Cognizant, ManTech, Unisys, and Maximus. To the left of the diagonal block, we find a (purple) square denoting that CACI listed L3Harris as a peer (within the weapons/surveillance manufacturing sector) and, to the right of the diagonal block, we find a (black) square showing that CACI listed Fidelity National Information Services (FIS) (within the Online Shopping and Payments sector). The coloring of the two off-diagonal squares has meaning: CACI's listing of L3Harris as a peer is given a unique color (purple) to denote that both companies lie within the defense/consulting family -- but not the same sector. Whereas CACI's listing of FIS as a peer is colored black.
Given that the black squares represent peering relationships between the tech and defense/consulting families, we can interpret the percentage of black squares as a measure of the interconnectedness -- through the eyes of each company -- of the two groups. Similarly, the number of purple squares represents the interconnectedness of the consulting and weapons/surveillance sectors, and the number of blue squares represents the degree to which tech companies in different tech subsectors view each other as peers.
While we can see from the large number of connections in the lower-left quadrant that IBM, Comcast and Verizon have identified multiple peers within the weapons and surveillance sector, we urge caution in comparisons of counts: Though Comcast listed six peers from the weapons and surveillance manufacturing sector (Raytheon, Boeing, Honeywell, Lockheed Martin, Caterpillar, and General Electric), and Leidos only mentioned three (Raytheon, Northrop Grumman, and L3Harris), Leidos only had a total of seven peers in our representative set of companies and Comcast had twenty-one. Thus, in a proportional sense, Leidos has more connections in the weapons/surveillance sector than Comcast by a ratio three-to-two. [13, 14].
Broadly speaking, we can observe from the rows corresponding to the Weapons/Surveillance sector that they view our Enterprise Tech representatives (particularly IBM and Cisco) as their most closely aligned peers -- with Intel (from Semiconductors) and AT&T and Verizon (from Telecoms) following. Whereas the Consulting and IT Services sector sees its sectoral peers as (somewhat in order of influence): Enterprise Tech, Online Payments, and Semiconductors. And the four companies most tying together the Weapons/Surveillance and Consulting/IT Services sectors appear to be: L3Harris, Leidos, Maxar, and Perspecta.
A Sense of Scale
As measured by recent market capitalization, the five largest companies in our study are:
- Apple (2.06 Trillion),
- Amazon (1.67 Trillion),
- Microsoft (1.66 Trillion),
- Alphabet (1.06 Trillion), and
- Facebook (760 Billion).
Out of these five, all but the middle of the pack, Microsoft, were recently condemned as monopolies in the historic October 6th House Antitrust Report. [15] This monumental, bipartisan recognition of the anti-competitive practices of the major tech companies was the result of a stew of influences, ranging from the outspoken scholarship of Tim Wu, Matt Stoller, and the Institute for Local Self-Reliance, to anti-trust scholars funded by Apple and Amazon attacking Google and Facebook, to concerns over censorship of conservative views. [16]
As part of the surrounding fervor, Twitter has often been lumped into the 'Big Tech' category despite its modest market value. (On October 15th it was 36 billion to Facebook's 760 and Apple's 2,060. And the payment processing company co-founded and led by Twitter CEO Jack Dorsey, Square, is valued more than twice as high as Twitter.) We have therefore anticipated usefulness in providing a ranked list of our studied companies from highest to lowest market values in Table 1.
yfinance
Python API.).


While by no means secret, we emphasize that the combined market values of a long list of major defense contractors (say, Honeywell, Lockheed Martin, Boeing, Raytheon, Northrop Grumman, General Dynamics, L3Harris, Leidos, Booz Allen, HII, CACI, and SAIC) yields just 584 billion, which is significantly less than that of the smallest member of our Big Five, Facebook. It is also interesting that Accenture is valued higher than any of the major defense contractors, and that Booz Allen, which has been described as a 'vast spying operation', is worth roughly half of recently public Palantir and one third of Twitter.
A High-Level Picture of Corporate Tax Dodging: pre- and post-TCJA
As we stated earlier, one of our primary motivations for writing this report was a desire to understand the long-term effects of the 2017 Tax Cuts and Jobs Act, which, in the name of reversing the erosion of the U.S. corporate tax base, nearly halved the U.S. federal statutory tax rate after roughly 25 years of stability. The data curation associated with manually building up the tax histories for 57 companies -- many of which spanned several decades -- comprised the bulk of our overall workload.
We will see from a comparison of Figures 3 and 4 that the companies in our study generally have dramatically lower worldwide effective tax rates since the passage of the TCJA -- even after removing one-time impacts such as AT&T's $21 billion benefit on remeasured deferred tax liabilities (as depicted in Table 3). And a ranking of companies by their combined effective tax rate over their entire history of public filings is provided in Table 2.
Overall Historical Taxation Rates
While our pre- and post-TCJA tax rate comparison study the average taxation rates before FY2017 and over the most recent two fiscal years (after removing one-time TCJA impacts), it is of independent interest to provide the overall effective tax rates of major companies over their entire (public) tax history. We therefore made available such a ranking -- from lowest to highest taxation rates -- in Table 2. Overall, historical effective tax rates were computed in the manner that most naturally extends the single-year calculation: by individually summing up the (Continuing) Provision for Income Taxes and Income Before Income Taxes over the years when both were provided and then taking the ratio of the former over the latter.
| Rank | Legal Name | Logo | Fiscal Years | Effective Tax Rate |
|---|---|---|---|---|
| 1. | Broadcom Inc. | 2005-2019 | N.M. $7.7B benefit on $11B income |
|
| 2. | NXP Semiconductors N.V. | 2017-2019 | N.M. $287M benefit on $4.4B income |
|
| 3. | Hewlett Packard Enterprise Company | 2013-2019 | N.M. $70M benefit on $12.6B income |
|
| 4. | Twitter, Inc. | 2010-2019 | N.M. $1.85B benefit on $1.76B loss |
|
| 5. | Maxar Technologies Inc. | 2016-2019 | N.M. $212M benefit on $1.00B loss |
|
| 6. | DXC Technology Company | 2014-2020 | N.M. $250M benefit on $2.55B loss |
|
| 7. | Uber Technologies, Inc. | 2017-2019 | N.M. $214M benefit on $11.7B loss |
|
| 8. | Snap Inc. | 2015-2019 | N.M. $30M benefit on $6.65B loss |
|
| 9. | Nvidia Corporation |  |
1994-2020 | 6.89% |
| 10. | Dell Technologies, Inc. | 1990-2013, 2015-2020 | 11.8% | |
| 11. | Netflix, Inc. | 2000-2019 | 13.7% | |
| 12. | Verizon Communications Inc. | 1991-2019 | 20.0% | |
| 13. | Genpact Ltd. | 2003-2019 | 20.2% | |
| 14. | PayPal Holdings, Inc. |  |
2013-2019 | 20.9% |
| 15. | HP Inc. | 1991-2019 | 21.3% | |
| 16. | Amazon.com, Inc. | 2002-2019 | 21.3% | |
| 17. | The Boeing Company | 1991-2019 | 21.7% | |
| 18. | Alphabet Inc. |  |
2001-2019 | 21.9% |
| 19. | eBay Inc. | 1996-2019 | 22.2% | |
| 20. | Facebook, Inc. |  |
2010-2019 | 23.7% |
| 21. | Apple Inc. |  |
1992-2019 | 23.8% |
| 22. | AT&T Inc. | 1997-2019 | 24.3% | |
| 23. | Comcast Corporation | 2000-2019 | 24.4% | |
| 24. | accenture plc |  |
1997-2019 | 24.6% |
| 25. | Microsoft Corporation |  |
1992-2020 | 25.5% |
| 26. | Cognizant Technology Solutions Corporation | 1994-2019 | 27.1% | |
| 27. | International Business Machines Corporation | 1991-2019 | 27.2% | |
| 28. | Honeywell International Inc. | 1991-2019 | 27.2% | |
| 29. | Intel Corporation |  |
1991-2019 | 27.3% |
| 30. | Oracle Corporation |  |
1992-2020 | 27.4% |
| 31. | Cisco Systems, Inc. | 1993-2020 | 27.5% | |
| 32. | Qualcomm, Inc. | 1992-2019 | 28.0% | |
| 33. | L3Harris Technologies, Inc. | 1992-2020 H1 | 28.6% | |
| 34. | Raytheon Technologies Corporation |  |
1991-2019 | 28.8% |
| 35. | General Dynamics Corporation |  |
1991-2019 | 29.2% |
| 36. | Intuit Inc. | 1992-2020 | 29.7% | |
| 37. | Huntington Ingalls Industries, Inc. | 2009-2019 | 30.1% | |
| 38. | Science Applications International Corporation | 2012-2020 | 30.3% | |
| 39. | Northrop Grumman Corporation | 1999-2019 | 30.4% | |
| 40. | Lockheed Martin Corporation | 1990-2019 | 30.4% | |
| 41. | Booz Allen Hamilton Holding Corp. | 2007-2020 | 30.7% | |
| 42. | CACI International Inc. | 1990-2020 | 31.1% | |
| 43. | Leidos Holdings, Inc. | 2002-2019 | 31.7% | |
| 44. | The Walt Disney Company | 1994-2019 | 32.6% | |
| 45. | ManTech International Corporation | 1997-2019 | 34.5% | |
| 46. | salesforce.com, inc. | 2001-2020 | 34.8% | |
| 47. | ASGN Incorporated |  |
1992-2019 | 35.4% |
| 48. | Motorola Solutions, Inc. | 1989-2019 | 41.5% | |
| 49. | Lumen Technologies, Inc. | 1991-2019 | 63.8% | |
| 50. | T-Mobile US, Inc. | 2000-2019 | 83.7% | |
| 51. | Lyft, Inc. | 2016-2019 | N.M. $4.05M charge on $4.88B loss |
|
| 52. | Advanced Micro Devices, Inc. | 1989-2019 | N.M. $28.7M charge on $5.22B loss |
|
| 53. | Palantir Technologies, Inc. |  |
2018-2019 | N.M. $21.5M charge on $1.14B loss |
| 54. | Square, Inc. | 2012-2019 | N.M. $12.9M charge on $408M loss |
|
| 55. | Kratos Defense & Security Sol'ns, Inc. |  |
1997-2019 | N.M. $17.3M charge on $515M loss |
| 56. | Tesla, Inc. |  |
2006-2019 | N.M. $253M charge on $6.91B loss |
| 57. | Perspecta Inc. |  |
2015-2020 | N.M. $110M charge on $83M loss |
The most surprising conclusion from the Table is that Broadcom, NXP, and HPE each reported a combined worldwide tax benefit on an overall positive amount of earnings. Five companies received net tax benefits on net operating losses (Twitter, Maxar, DXC, Uber, and Snap), while six companies have avoided paying even the post-TCJA U.S. federal statutory rate of 21% (Nvidia, Dell, Netflix, Verizon, Genpact, and PayPal).
One-Time TCJA Impacts
In order to compute predictive post-TCJA effective tax rates from the small number of years since its passage at the end of 2017, we took an approach similar to that of ITEP's report on the first year post-TCJA and removed one-time impacts from the act. The two primary components were:
- The remeasurement of deferred tax assets and liabilities at the new U.S. federal statutory rate of 21% rather than 35%, and
- The transition tax on the mandatory repatriation of unremitted foreign earnings.
Readers interested in the details of the various components of the TCJA are encouraged to read the series of explanatory articles written by ITEP. (For example, ITEP released an overview of the effectiveness of two provisions have not discussed: Global Intangible Low Taxed Income (GILTI) and Base Erosion and Anti-Abuse Tax (BEAT).)
Rather than simply discarding the calculation of these one-time impacts -- which required a careful read of the FY2019 Form 10-K filing from each company -- we ranked companies based upon how large their one-time benefit was in Table 3.
It is perhaps surprising that eight of the fifty-seven companies we reviewed reported more than a billion dollars of immediate, one-time benefit from the passage of the TCJA (AT&T, Verizon, Comcast, Broadcom, T-Mobile US, Walt Disney, Boeing, and Lumen). The most extreme case is AT&T, who reported $21 billion dollars of immediate tax benefits -- largely from the remeasurement of their deferred tax liabilities at the 21% rate. Yet, despite CBS MoneyWatch calculating AT&T saving $42 billion from the TCJA over the next decade, since 2018 the company has laid off more than 37,000 employees and failed to fulfill their commitments to the Communication Workers of America.
Pre- and Post-TCJA Tax Rates
Once we were equipped with the amount that each company benefited or provisioned for one-time TCJA impacts in each year (though we only showed the sum in Table 3), we can easily compute the effective tax rates post-TCJA by subtracting one-time benefits from provisions for income tax amounts. Due to the complication of different companies choosing different starting months for their fiscal years, we settled on the most recent two fiscal years (either FY18-19 or FY19-20) with one-time TCJA impacts removed as a representative of their post-TCJA taxation rates. A ranking of our studied companies, from lowest-to-highest effective tax rates over this two-year period after adjusting for one-time TCJA impacts, is provided in Table 4.
In comparison with Table 2, which is the equivalent over entire (public) corporate tax histories, one notices an overwhelming increase in the number of companies with worldwide effective tax-rates less than the post-TCJA statutory tax rate of 21%. For example, out of companies reporting positive income before income taxes over the period of study, Table 2 reported 10 out of 45 companies paying less than 21% (with 3 of them reporting overall tax benefits on their income), and narrowing down to pre-FY2017 effective tax rates yields only 8 out of 45 profitable companies paying less than 21% (with 2 reporting overall tax benefits). But post-TCJA, we see 32 out of 45 companies below 21% (with 5 reporting overall tax benefits on income). Thus, post-TCJA, four times as many profitable companies were observed with effective tax rates below 21%.
It's worth unpacking this last observation: the nominal purpose of the Tax Cuts and Jobs Act slashing the U.S. corporate statutory rate down to 21% was to counter a tendency of U.S. corporations to avoid paying U.S. taxes by shifting income into foreign tax havens. This would have been defensible if two conditions had been met: (i) companies generally had a pre-TCJA (worldwide) effective tax rate around 21%, and (ii) passage closed off the ability of companies to continue making use of offshore tax havens. Neither is true, as the majority of companies only had their global effective tax rates drop below 21% post-TCJA, and companies such as Nvidia and Broadcom continue to avoid billions of dollars in taxes through havens in Singapore and the British Virgin Islands. The United States essentially just added itself to the list of tax havens due to assuming that it only has the power to incentivize, not compel, its own corporations.
We provide more visual means of comparing the overall movement of effective tax rates pre- and post-TCJA through Figures 3 and 4. The former plots the effective tax rates of profitable companies before fiscal year 2017 as a function of their market capitalization, and the latter does the same for each company's most recent two fiscal years after adjusting for one-time TCJA impacts.
Even a cursory examination of Figures 3 and 4 reveals the migration of the majority of profitable companies underneath the post-TCJA U.S. corporate statutory tax rate of 21% that we discussed in relation to Tables 2 and 4. We emphasize that Figure 3 lists Maxar and DXC Technology as outliers due to receiving net tax benefits on positive pre-2017 income; Figure 4 similarly lists HPE, Broadcom, Twitter, HP, and Boeing for the post-TCJA era.
Beyond the companies that managed to turn a profit from taxes (HPE, Broadcom, Twitter, HP, Boeing, Maxar, and DXC), we can visually determine the companies with the most regressive taxation. Pre-2017, we might name: HPE, eBay, Nvidia, Alphabet, Microsoft, and Apple due to lying in the extremes of high market caps and low taxation rates. Whereas, post-TCJA, we might further add: Square, AMD, IBM, Netflix, and Apple.
We can easily translate knowledge of these post-TCJA tax rates into the number of billions of dollars per year each company is avoiding paying relative to the 35% and 21% statutory rates. For example, Apple is now saving roughly $2.63B per year relative to the TCJA statutory rate of 21% and $12.3B per year relative to the previous 35% rate. Whereas Microsoft is saving about $3.55B (vs. 21%) and $10.3B (vs. 35%) per year, Amazon $0.86B (vs. 21%) and $2.63B (vs. 35%), Alphabet $3.10B (vs. 21%) and $8.31B (vs. 35%), and Facebook $0.48B (vs. 21%) and $3.99B (vs. 35%).
Reconciling Effective and Statutory Tax Rates
In order to explain the regressive phenomenon of Project Maven prime contractor ASGN having a small market cap ($3.75B) and relatively high tax rate (25.2% adjusted post-TCJA), while GPU-manufacturer Nvidia can have a high market cap ($345B) and low tax rate (4.33% adjusted post-TCJA), we turn to the sections of their most recent Form 10-K filings which reconcile their effective tax rates to the U.S. federal statutory rate of 21% (see Figures 5 and 6).
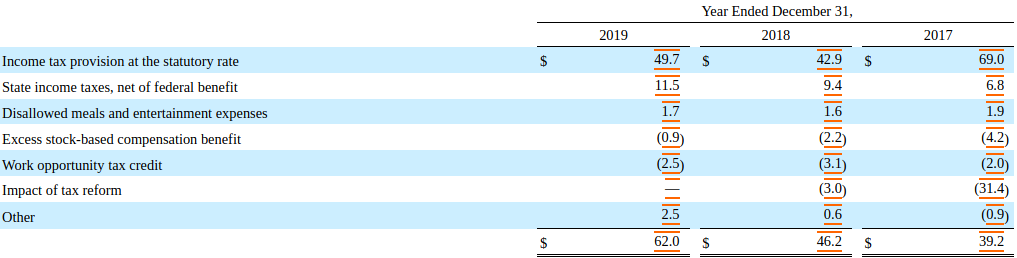
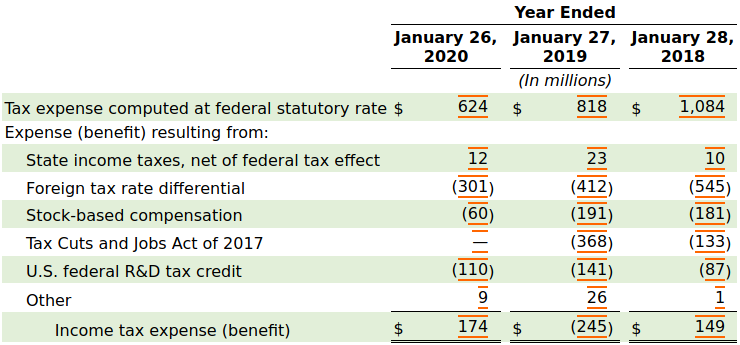
We can compute from Figure 5 that the largest adjustments leading to ASGN's effective tax rate of 26.2% for the fiscal year ending December 31, 2019 were: an $11.5M charge (+4.86%) for state income taxes, a pairing of a (-1.06%) Work opportunity tax credit and an 'Other' charge (+1.06%) that cancelled each other out, a (+0.72%) charge for meals and entertainment, and a (-0.38%) credit for excess stock-based compensation. Whereas Figure 6 shows that, for roughly the same time period, Nvidia had an effective tax rate of 5.86% resulting from a (-10.1%) savings from tax havens, an R&D tax credit (-3.70%), a (-2.02%) stock-based compensation credit, and only paid a small amount of state taxes (+0.40%). [17]
We can thus conclude that the combination of Nvidia's continued usage of foreign tax havens and its near-total avoidance of state and local taxes explains more than 14 points of the 20.3 point difference between ASGN and Nvidia's effective tax rates over roughly the same period (2019 calendar year). And that Nvidia's -3.7% R&D credit and -2.02% stock-based compensation credit (vs. ASGN's -0.38%) account for most of the remainder.
Yet Nvidia is not the most abusive company in our study: as noted in Figure 4, Hewlett Packard Enterprise (HPE), Broadcom, Twitter, HP, and Boeing each managed to report a tax benefit over their most recent two fiscal years (after adjusting for one-time TCJA impacts) despite positive income before income taxes. Broadcom's own FY2019 Form 10-K admits:
If the tax incentives or tax holiday arrangements we have negotiated in Singapore and other jurisdictions change...the amount of corporate income taxes we have to pay could significantly increase. Our operations are currently structured to benefit from the various tax incentives and tax holidays extended to us in various jurisdictions...
Sectoral Taxation Rates
To help avoid overly broad extrapolations from the above comparison between Nvidia and ASGN, condensations of Figures 3 and 4 down to their identified sectors are respectively provided by Figures 7 and 8. The Consulting and IT Services sector appears to be the only instance of an increase in effective tax rates since the passage of TCJA -- a phenomenon largely explained by the increase in tax rate of the sector's largest representative, Accenture, seen in Figures 3 and 4. The dramatic decreases in the Enterprise Tech and Weapons/Surveillance sectors appears to be a general trend accelerated by both HPE and Boeing reporting overall tax benefits despite positive income over their last two fiscal years. Despite the optics of Genpact and Accenture respectively domiciling in Bermuda and Ireland, we see that the Consulting/IT Services sector has a smaller average market cap and now a higher effective taxation rate than our other sectors of study.
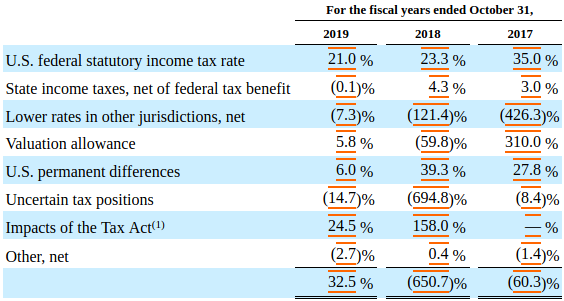
An analogue for Hewlett Packard Enterprise of the effective tax rate reconciliation demonstrated for Nvidia in Figure 6 is given in Figure 9. HPE reported 426.3% and 121.4% tax benefits from "Lower rates in other jurisdictions" in FY 2017 and 2018, respectively, a 694.8% tax benefit from "Uncertain tax positions" in FY2018, and an overall tax benefit roughly 6.5 times as large as their pre-tax income in FY2018 (amounting to more than $1.7B in benefits on $268M of earnings).
Conclusions
Through a manual analysis of more than 1000 Form 10-K filings and proxy statements from publicly-traded tech, consulting, and defense companies, we stitched together the entire (public) tax histories of 57 representative companies and presented the web of connections resulting from the self-defined peer groups of a larger group of 72 companies. Each resulting detailed tax history and peer group was then made available through the interface provided at techinquiry.org/lobbying.
An analysis of both pre- and post-TCJA tax rates demonstrated that four times as many profitable companies in our sample had (worldwide) effective tax rates less than 21% after passage of TCJA than before. And a comparison of the reconciliations of the tax rates of Maven contractors ASGN (a staffing company) and Nvidia (a GPU manufactuer) underlined ITEP's arguments that continued usages of offshore tax havens, stock-based compensation and R&D tax credits, and minimized state and local taxes are contributing to regressive corporate taxation rates.
We further identified HPE, Broadcom, Twitter, HP, and Boeing as having each reported an overall tax benefit over their most recent two fiscal years -- even after adjusting for one-time TCJA impacts -- despite having reported net positive earnings before income taxes. Of the profitable companies actually paying taxes, we identified IBM, Netflix, Nvidia, Alphabet, Microsoft, Amazon, and Apple as particularly problematic due to the regressive nature of their high market capitalizations and low effective tax rates post-TCJA.
Even relative to the new U.S. statutory rate of 21%: Apple is allowed to avoid provisioning roughly $2.63B per year, Microsoft $3.55B, Alphabet $3.10B, Amazon $0.86B, and Facebook $0.48B. (And relative to the pre-TCJA rate of 35%: Apple is saving $12.3B per year, Microsoft $10.3B, Alphabet $8.31B, Amazon $2.63B, and Facebook $3.99B.)
We hope that, beyond the current wave of scrutiny of the abusive market practices of "Big Tech", there will be a renewed movement to hold tech companies accountable for increasingly aggressive tax avoidance. Google's record-setting lobbying, and previous ability to suppress anti-monopoly critique within the influential New America Foundation, is not separate from its effective tax rate of 12%. [18] The influence of the Hewlett and David and Lucille foundations is not free from the aggressive tax-dodging of HP and HPE. The policy reach of the Gates Foundation and Gates Policy Institute is not disjoint from Microsoft's 14% tax rate, nor is Bezos's $10B climate pledge disconnected from Amazon provisioning just 15%. [19]
A healthy civil society cannot be run on the whims of billionaires, even if channeled through foundations. May we tax them instead of begging.
Acknowledgments
The author would like to thank an anonymous accountant at one of the Big Four for answering detailed questions about the Tax Cuts and Jobs Act and associated maneuvering. He would also like to thank Shauna Gordon-McKeon for detailed comments on a draft (including recommending DataTables), Liz O'Sullivan for constructive critique on the overall structure of the report, and Lee Fang for pointing out the investor meeting quote about Google, Amazon, and Microsoft's involvement in Project APOLLO.
Conflict of Interest Disclosure
This work was entirely self-funded. The author acknowledges that they were formerly an employee at Google, and that Liz O'Sullivan is both a board member of Tech Inquiry and a former employee of Clarifai.
Appendix
Stitching Together Tax Histories from Form 10-Ks
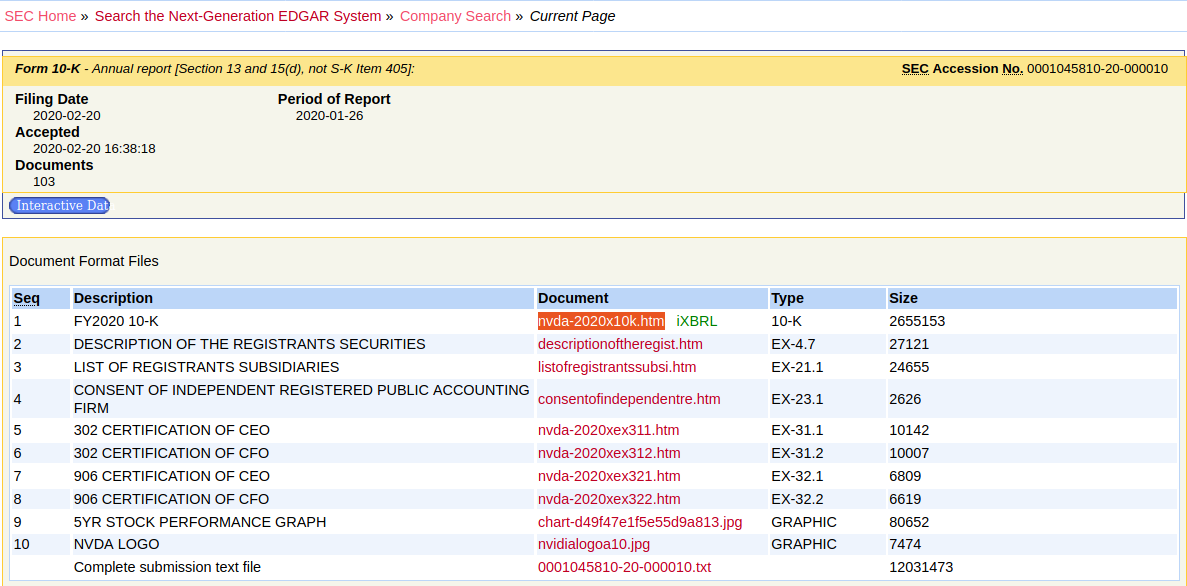
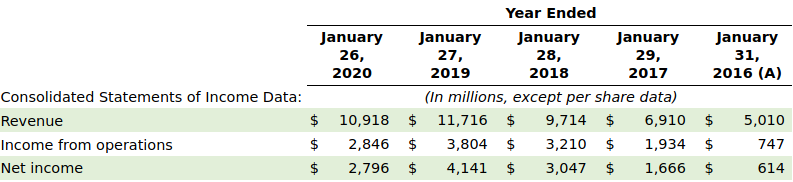
The Form 10-K filings submitted each year to the Securities and Exchange Commission by companies which are publicly traded in U.S. markets typically provide either three or five years of information on (continuing) income before income taxes and the corresponding provision for income taxes; three years are provided by the 'Consolidated Statement of Earnings' but the custom five-year summary in the 'Selected Financial Data' section occasionally provides an extended window. Given our goal of combining taxation histories over the union of the time periods from -- often decades -- of yearly filings, we undertake a process of stitching together the data from each filing by keeping the most recent listings.
Since Nvidia Corporation was identified in our report as a blue chip stock which makes aggressive usage of offshore tax havens even post-TCJA, we demostrate through Figures 10-16 how to combine Nvidia's most recent two Form 10-K filings. Interactive graphics demonstrating the result of continuing this process across more than twenty 10-K filings are provided by Figures 17 and 18.
sec.gov.
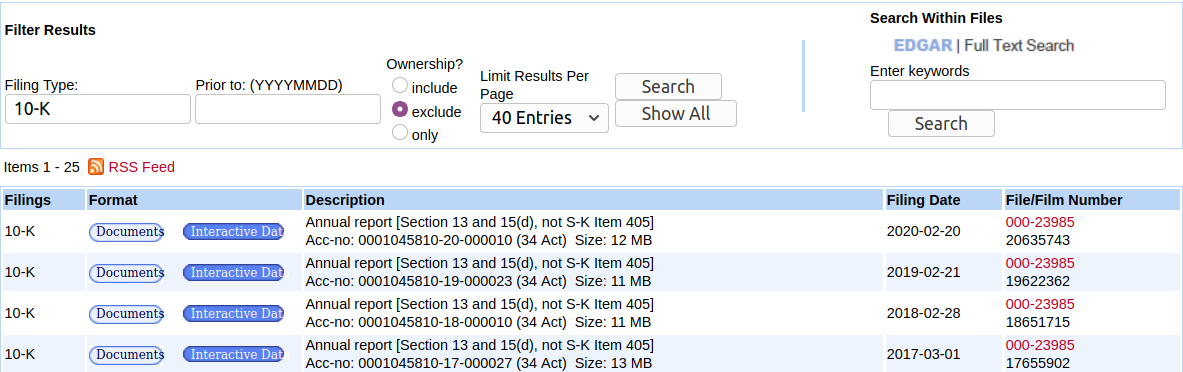
sec.gov).
The link to the primary filing document is highlighted.
sec.gov).
sec.gov).
In this case, Nvidia chose to provide the revenue, operating
income, and net income over five years. While the five-year
time-frame is standard, though occasionally expanded, one cannot
depend upon more than Revenue and (Continuing) Net Income being
provided. For this reason, the Selected Financial Data should be
treated as an extended window into a few variables, and the
Consolidated Statements of Income/Earnings/Operations should be
seen as the backbone.
sec.gov).
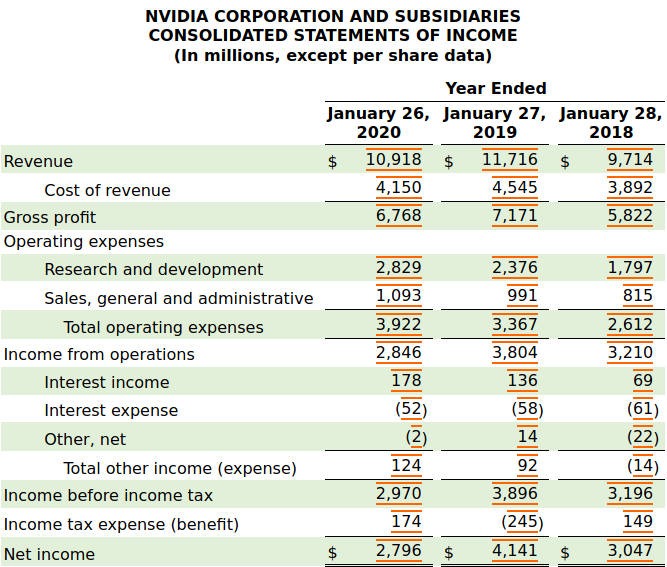
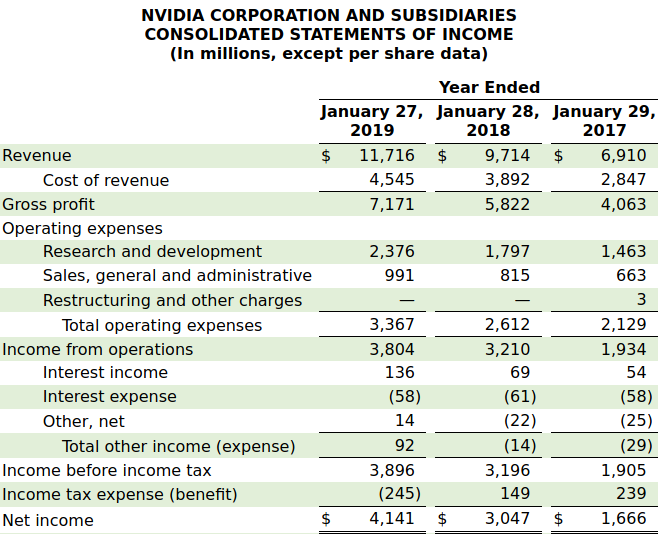
The exact name of the table may vary, with typical other names
being "Consolidated Statements of Operations" or
"Consolidated Statements of Earnings". This table almost always
consists of three years of data, and our primary fields of
interest are the (Continuing) Income Before Income Taxes and
the (Continuing) Provision for Income Taxes
(i.e., "Income tax expense"), whose ratio provides
us the company's (Continuing) Effective Tax Rate.
sec.gov).
Given that the FY2019 and FY2018 data is provided by the
more recent FY2020 10-K filing, we only incorporate the data
from FY2017 into our overall income tax history (though the
redundant years are useful for verification purposes).
Forming Peer Groups from Executive Compensation Proxy Statements
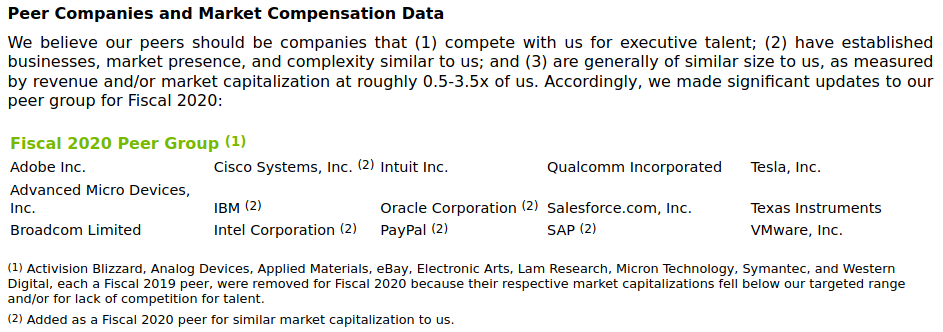
We demonstrate the simple process of extracting a peer group on Nvidia Corporation, through we emphasize that it is essentially identical for other companies. Picking up from the result of Figure 10 from the previous subsection, Figure 17 demonstrates entering in the term "peer group" into Nvidia's profile page on sec.gov and Figure 18 demonstrates the selection of the most recent Proxy Statement. A screenshot from said proxy statement listing Nvidia's FY2020 peer group is shown in Figure 19.
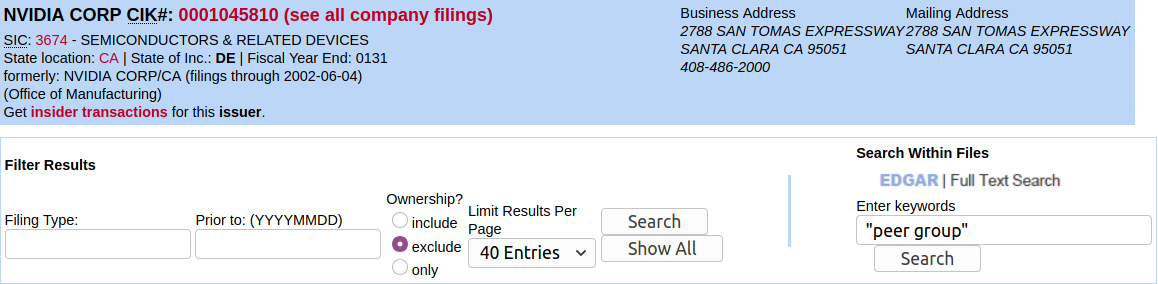
sec.gov.
The most recent result has been highlighted.
A Rough Sectoral Hierarchy
In order to capture a reasonable percentage of each company's self-defined peer group, we chose 72 technology and defense/consulting companies publicly traded in U.S. markets. The myriad companies in the technology family were then divided into seven subcategories:
- Media and Telecommunications
- Semiconductors
- Social Media
- Online Shopping and Payments
- Transportation
- Consumer Products
- Enterprise Products
Whereas the defense and consulting family was separated into only two subcategories:
- Weapons and Surveillance System Manufacturers
- Consultancies, Systems Integrators, and IT Services
Interconnections were then probed via the extraction of self-defined peer groups from recent corporate proxy statements, which are primarily used for executive compensation purposes, for representative companies from each of the identified sector. A simple layout of these companies and their peers -- both incoming and outgoing -- is shown in Figure 1, and a more sophisticated, two-level adjacency visualization of the same graph is shown in Figure 2 to help avoid the well-known 'hairball' problem.
For 57 of the 72 companies, we stitched together their entire public tax histories from yearly Form 10-K filings to the Securities and Exchange Commission. This process was the majority of the work behind this report and involved manual review of more than 1000 such filings.
Technology Companies
Rather than restricting ourselves to the traditional "Big Tech" groupings of Google, Apple, Facebook, Amazon, and Microsoft (GAFAM) or Facebook, Apple, Amazon, Netflix, Google (FAANG), we selected a group of 44 tech companies split into six sectors. Companies which were included in the peer graph, but not the tax history analysis, were marked with an asterisk.
We then annotated and sorted each peer group member via a recent measurement of their market capitalization to provide a sense of scale; see Table 1 for a complete listing and the surrounding discussion for further information.
1. Media and Telecommunications
-
 Verizon Communications Inc.: $241B
-
 Netflix, Inc.: $239B
-
 The Walt Disney Company: $230B
-
 Comcast Corporation: $209B
-
 AT&T Inc.: $196B
-
 T-Mobile US, Inc.: $145B
-
 Charter Communications, Inc.*: $130B
-
 Lumen Technologies, Inc. (fka CenturyLink): $10.9B
While this category was originally planned to consist of only telecommunications companies, during the course of writing we realized that many of its members had a prominent secondary role in media. The logo of the National Broadcasting Company (NBC) is clear within that of Comcast's -- as a result of their merger -- but it is less appreciated that AT&T is the parent company of the Cable News Network (CNN). And that both the American Broadcasting Company (ABC) and Hulu are owned by The Walt Disney Company. We also point out that Verizon Media (f.k.a. Oath) is the result of Verizon merging AOL and Yahoo!.
And while the original telecommunications list contained Motorola Solutions, whose surveillance work playing an increasingly central role in its business made it an outlier, we ultimately moved it into the weapons manufacturing category as a near-peer of the Harris component of L3Harris Technologies. Though, the vast scale of covert surveillance by AT&T (and, to a lesser degree, Verizon) has been widely documented.
2. Semiconductors
-
 Nvidia Corporation: $345B
-
 Intel Corporation: $229B
-
 Broadcom Inc.: $154B
-
 Qualcomm, Inc.: $145B
-
 Texas Instruments Incorporated*: $140B
-
 Advanced Micro Devices, Inc.: $97.6B
-
 NXP Semiconductors N.V.: $40.0B
-
 Western Digital Corporation*: $11.6B
The motivating members of this category were: Nvidia, Intel, AMD, and the pairing of Broadcom and Qualcomm -- the former, which recently redomiciled from Singapore to the United States, was blocked by Donald Trump from acquiring Qualcomm in 2018 due to bipartisan concerns of influence from China. [21]
A complicated sequence of acquisitions and divestitures has obscured that Broadcom owns the remnants of workplace/governmental surveillance firm Blue Coat Systems: Symantec's 'reverse-merger' of Blue Coat in 2016 led to an SEC investigation into former Blue Coat executives' accounting practices before the company sold its entire enterprise business (including Blue Coat) to Broadcom in 2019 -- renaming what was left NortonLifeLock. [22] Broadcom divested its Cyber Security Services business to Accenture the next year; Broadcom currently advertises a coupling of its 'Global Intelligence Network' with 'Blue Coat ProxySG'. [23]
And in 2018, a year before acquiring Symantec's enterprise division, Broadcom bought IT company CA Technologies for roughly $19B. CA Technologies had been involved in its own accounting fraud investigation in the early 2000s, ending with its former CEO, Sanjay Kumar, being sentenced to 12 years in prison (and testifying that the company's founder, Charles Wang, had directed the fraud). As we will see from our analysis of their taxation history, Broadcom, along with Nvidia and Netherlands-based NXP, employs some of the most aggressive tax avoidance strategies of all the companies in our study.
That Nvidia is the dominant manufacturer of accelerators for machine learning is well-known, yet there has been little-to-no worker organizing around their foundational role in drone surveillance. As far back as 2013, one of Nvidia's senior executives was advertising their products as a solution for the forecast of "one-third" of the active-duty Air Force being required for manually monitoring drone and satellite video surveillance footage. And, at Nvidia's flagship 2017 conference, then-head of Project Maven, Jack Shanahan, emphasized that the company's chips would help power AI to prevent analysts in the U.S. military from "looking at full-motion video, staring at screens 6, 7, 8, 9, 10, 11 hours at a time."
3. Social Media
-
 Facebook, Inc.: $760B
-
 Snap Inc.: $41.2B
-
 Twitter, Inc.: $36.4B
We mentioned in the introduction that Facebook -- which is essentially the parent company of the Chan-Zuckerberg Initiative (CZI) -- has been outsourcing its content moderation to numerous abusive contractors: Cognizant in Tampa, Accenture in Austin, and General Electric spin-off Genpact in Hyderabad.
And according to a recent statement from the U.S. House Antitrust Subcommittee, Facebook has also been maintaining a monopoly on social media in the United States. Beyond having attempted to acquire both of its current major competitors -- Twitter in 2008 and Snapchat in 2013 and 2016 -- before buying Instagram, Facebook CEO Mark Zuckerberg told one of its co-founders that "refusing to enter into a partnership with Facebook, including an acquisition, would have consequences". [24]
4. Online Shopping and Payments
-
 Amazon.com, Inc.: $1.67T
-
 VISA Inc.*: $438B
-
 PayPal Holdings, Inc.: $238B
-
 Fidelity National Information Services, Inc.*: $89.1B
-
 Square, Inc.: $83.7B
-
 eBay Inc.: $38.8B
The original motivation of this category was to encompass the similarities between Amazon, eBay, PayPal, and Twitter-associated credit card processing company Square. Credit card company VISA and payment processing company Fidelity National Information Services (FIS) were both added due to frequently being listed as peers of our core group of 57 companies. The complicating factor is Amazon: in addition to being larger (by market capitalization) than the other five members combined, Amazon's cloud computing division (Amazon Web Services, or AWS) generates the majority of the company's profits despite consisting of a fraction of the revenue of their storefront.
AWS became the primary computing platform for the U.S. intelligence community in 2014 as a result of a $600M contract; their attempt to leverage this contract into a deal to support the entire Department of Defense is ongoing despite the DoD having awarded the contract to Microsoft's Azure platform twice. And Amazon's predilection for working with current and former intelligence analysts appears to extend into their treatment of their employees: in addition to being caught publicly posting a job description for an 'Intelligence Analyst' to track 'organized labor', the company has pointedly fired labor organizer Christian Smalls and climate organizers Emily Cunningham and Maren Costa.
We also note that three of the companies we have selected to represent the payment processing and online shopping sector are associated with a news organization: Amazon CEO Jeff Bezos bought The Washington Post in 2013 for $250M, and The Intercept is owned by eBay founder, and major PayPal shareholder, Pierre Omidyar. Goldsmith and Wu's Who Controls the Internet? provides a detailed history of eBay's evolution from one-on-one service via community manager "Uncle Griff" to constant, close collaboration with police and federal authorities on fraud prevention. While their book was written in 2006, these transitions would later lead to numerous arrests and eBay's executives working with their security team to stalk and harass mild critics. And Palantir Technologies -- perhaps the only 'secretive' company to receive heavy press coverage on a near-daily basis -- is the direct descendant of PayPal's 'Igor' fraud-detection software.
5. Transportation
-
 Tesla, Inc.: $418B
-
 Uber Tech., Inc.: $60.0B
-
 Lyft, Inc.: $7.99B
While it might appear that the 'transportation' categorization is a weak link between ridesharing companies Uber and Lyft vs. electric vehicle manufacturer Tesla, their similarities run deeper. All three companies are:
6. Consumer Products
-
 Apple Inc.: $2.06T
-
 Microsoft Corporation: $1.66T
-
 Alphabet Inc.: $1.06T
-
 Adobe Inc.*: $240B
-
 Intuit Inc.: $89.5B
-
 HP Inc.: $26.9B
-
 NortonLifeLock Inc. (fka Symantec)*: $13.1B
To some degree, this category, and the following Enterprise Products category, are defined to split up the major tech companies which remain after the definition of the above components.
We chose to prioritize Microsoft and Alphabet's large consumer components, despite both having competed for the $10B JEDI Indefinite Delivery Contract (though Google dropped out due to missing certifications). And despite Microsoft's pointed attempts at positioning itself as an opponent of surveillance, it has perhaps the deepest roots of any consumer-facing technology company in police surveillance and U.S. defense -- as its JEDI win underscores -- and has pointedly defended its international human rights censorship in Bing (which continues to this day).
Intuit, the parent company of TurboTax and QuickBooks, was included both because of being a frequent peer of other included tech companies (it is next door to Google in Mountain View) and because it seemed of interest to measure the tax history of a company primarily known for tax software. Intuit has been the subjective of an in-depth investigation from ProPublica over its lobbying to prevent the U.S. government from simplifying personal tax filings; as a result of the reporting, the Federal Trade Commission has been investigating whether Intuit 'deceived tax filers into paying when they could have filed for free'.
Both HP and NortonLifeLock are the remnants of divestitures of their original enterprise divisions -- the former ended up split between Hewlett Packard Enterprise, DXC Technology, and Perspecta, while the latter is split between Broadcom and Accenture. (See our previous report for a detailed discussion of Alphabet's federal contracting posture and the influence of HPE, DXC, and Perspecta.)
In terms of civil society and legislative influence: Microsoft's founder co-runs both the Bill & Melinda Gates Foundation and the affiliated lobbying group, the Gates Policy Initiative, Hewlett and Packard respective launched the Hewlett Foundation and the David and Lucile Packard Foundation, while Google runs the much smaller Google.org. Yet, in terms of an overall lobbying spend analysis due to the Center for Responsive Politics, Google dominated in 2018 with $21.7M to Microsoft's $9.6M. [25]
7. Enterprise Products
-
 salesforce.com, inc.: $235B
-
 Oracle Corporation: $182B
-
 Cisco Systems, Inc.: $169B
-
 International Business Machines Corporation: $111B
-
 ServiceNow, Inc.*: $99.9B
-
 VMware, Inc.*: $64.4B
-
 Dell Technologies, Inc.: $52.3B
-
 Akamai Technologies, Inc.*: $17.7B
-
 Hewlett Packard Enterprise Company: $12.7B
Our last technology category can be considered to only have eight members, as, despite being publicly traded with a larger market cap, VMware is 81%-owned by Dell Technologies. And it is of note that VMware's subsidiary, Pivotal Software (dba VMware Tanzu), played a central role in the formation of 'Kessel Run', a spin-out of the Pentagon's Defense Innovation Unit that describes itself as the Air Force's "software factory". (We previously published a copy of one of Pivot's first such contracts with the Defense Innovation Unit which we procured through a Freedom of Information request.)
Both Cisco and Dell (as well as its former subsidiary, Perot Systems) featured prominently in the Snowden saga: the latter was where Snowden worked when he began collecting documents, and the former was shown to have its products occasionally subverted by U.S. intelligence agencies. Cisco has also been widely criticized for profiting from its central role during the early 2000s in the construction of China's 'Great Firewall'.
IBM and Oracle are similarly deeply connected to U.S. defense and intelligence agencies, though IBM didn't go so far as to name their company after a project with an intelligence agency. Like Cisco, IBM has a history of simultaneously profiting from U.S. defense contracts and supporting authoritarian governments.
The customer relationship management company Salesforce has been both criticized by immigrant rights groups for fueling the Immigration and Customs Enforcement agency and praised for its CEO's philanthropy. (Incidentally, the Salesforce Impact Fund -- which is separate from their nonprofit, salesforce.org -- was inspired by the impact investment company + nonprofit Omidyar Network, which is named after one of eBay's co-founders.)
Weapons, Surveillance, and Consultancies
As discussed in the introduction, one of our goals was to understand the linkages between tech companies with consulting/IT services companies (such as Accenture, Cognizant, Genpact, and ASGN) and the major weapons/surveillance-system manufacturers (such as Raytheon, L3Harris, and Maxar). What follows is an attempt to split defense and/or consulting companies into two coherent families.
1. Consulting and Professional Services
-
 accenture plc: $145B
-
 Automatic Data Processing, Inc.*: $64.4B
-
 Cognizant Tech. Solutions Corp.: $40.0B
-
 Palantir Technologies, Inc.: $21.8B
-
 Leidos Holdings, Inc.: $12.5B
-
 Booz Allen Hamilton Holding Corp.: $11.3B
-
 Genpact Ltd.: $7.40B
-
 CACI International Inc.: $5.42B
-
 DXC Technology Co.: $5.13B
-
 Science Applications Int'l Corp.: $4.62B
-
 Maximus Inc.*: $4.21B
-
 ASGN Incorporated: $3.75B
-
 Perspecta Inc.: $3.27B
-
 ManTech International Corp.: $2.91B
-
 Unisys Corp.*: $735M
The original motivation for this group was to house the combination of the peer group of the Project Maven prime contractor (ASGN) and the abusive consulting/services companies that Facebook and Google have outsourced content moderation to (i.e., Accenture, Cognizant, and Genpact). A natural completion is to expand out the set of 'systems integrators' from companies like Accenture and Cognizant to Booz Allen, CACI, DXC Technology, Leidos ("one of the leading systems integrators in science, technology, and engineering"), ManTech International, Perspecta, SAIC, and Unisys. (We would have included IBM were it not already placed in the Enterprise Tech Products sector.)
Outsourcing company Maximus can similarly be seen as a continuation of the grouping of Genpact, Cognizant, and Accenture, whereas Automatic Data Processing fits into a more general 'IT services' category due to its focus on "simplify[ing] HR and payroll with software and services". Our last outlier -- Palantir -- is the most famous of the group, though it continues to be unclear whether to categorize them as a defense consultancy or defense software company. (Though Palantir does not meaningfully appear in our tax-rate analysis due to never having turned a profit, or in our peer group analysis due to only recently being publicly listed.)
2. Weapons and Surveillance System Manufacturers
-
 Honeywell International Inc.: $121B
-
 Lockheed Martin Corporation: $108B
-
 The Boeing Company: $92.8B
-
 Raytheon Technologies Corporation: $92.4B
-
 Caterpillar Inc.*: $89.4B
-
 General Electric Company*: $60.1B
-
 Northrop Grumman Corporation: $52.5B
-
 General Dynamics Corporation: $40.4B
-
 L3Harris Technologies, Inc.: $37.5B
-
 Motorola Solutions, Inc.: $29.1B
-
 Huntington Ingalls Industries, Inc.: $5.99B
-
 Kratos Defense & Security Solutions, Inc.: $2.59B
-
 Maxar Technologies Inc.: $1.74B
While several of the members of this group are the most well-known U.S. weapons manufacturers, some are less publicly affiliated with combat and surveillance systems. For example, General Electric explains that it produces 'non-explosive components and parts for weapons systems' but will not 'manufacture, assemble, sell or service cluster bombs, land mines or nuclear weapons'. However, in 2001, the company unsuccessfully attempted to acquire Honeywell, who is notorious for building cluster bombs during the Vietnam War. We would have included prominent British and Israeli weapons manufacturers BAE Systems and Elbit Systems -- whom both frequently contract with the U.S. government -- if they had submitted any Form 10-K filings to the SEC.
For its part, Caterpillar boasts that 'virtually every U.S. military engagement since World War I has relied, in some way, on Cat[erpillar] equipment'. Caterpillar also internationally exports various components of tanks (their name, 'caterpillar', is synonymous with 'continuous track' tank treads), and its armored bulldozers are repurposed by both the Israeili Defense Forces and SWAT teams across the United States.
Kratos, which was known as Wireless Facilities, Inc. until 2007, transitioned
"from a commercial communication business [into a] provider of high performance, jet-powered unmanned aerial drone systems, space and satellite communications, microwave electronics [and lasers], rocket systems for missile defense and hypersonic programs and C5ISR"
upon appointment of Eric M. DeMarco as CEO. Before joining Kratos (then WFI), Mr. DeMarco had been the President and Chief Operating Officer of Titan Corporation, which was investigated alongside CACI for its interrogators' human rights abuses at the Abu Ghraib prison. The Stanford Hoover Institution's Amy Zegart has been on their board since 2014 and has been a public critic of tech companies electing to not directly contribute to weapons systems. But Kratos is largely absent from our tax-rate analysis due to having lost an average of $29M/year over the last decade.
The second-smallest company in our entire study (measured by market capitalization) is Maxar Technologies, a holding company for: DigitalGlobe (a major supplier of satellite imagery for Google Maps and intelligence communities), Radiant Solutions (a geospatial analytics company), and Vricon ("a global leader in satellite-derived 3D data for defense and intelligence markets, with software and products that enhance 3D mapping, Earth intelligence data, military simulation and training and precision-guided munitions"), which was a joint venture with missile manufacturer Saab AB until July of this year.
Motorola Solutions is the remainder of cellphone manufacturer Motorola, Inc. after selling its 'mobility' divison to Google in 2011. Their subsidiary, Avigilon, dominates the License Plate Recognition market and has been cited by social-media-scraping facial recognition vendor Clearview AI CEO Hoan Ton-That as breaking ground in a manner similar to Clearview.
As a result of worker action opposing participation in drone warfare, Google released a set of "AI Principles" that shifted its role from algorithmic development to cloud support. As a result, the Department of Defense, and then Office of the Director of National Intelligence, responded to allegations that Silicon Valley might 'turn its back on the DoD' by releasing their own ethical pronouncements under a similar name, albeit restricted to issues which are entirely new to machine learning and purposefully avoiding any commitment to not building Lethal Autonomous Weapons Systems.
Yet, Bob Work, the former United States Deputy Secretary of Defense -- now Principal at the Biden-affiliated lobbying firm WestExec Advisors, has previously called The Campaign to Stop Killer Robots "unethical" and "immoral".
One of the surprising conclusions of our industry-wide tax rate analysis is that, despite the optics of their domiciles, Accenture and Genpact are far from the most aggressive with their tax avoidance. Genpact Ltd. was spun off from General Electric Company in 2005 after operating for eight years as the back-office services operation of GE Capital under the name GE Capital Internet Services (GECIS). The mentioned quotes are attributable to an investor presentation on May 24, 2018 by Jim Brill, Senior Vice President and Chief Accounting Officer of ASGN Incorporated. The presentation was entitled "The New Workforce" and took place at the 19th Annual B. Riley FBR Institutional Investor Conference; while the slide deck is readily available, the most interesting information is only verbally stated by Brill. Within the slides themselves, Project APOLLO is referred to as a $32M+ contract value with end date in 2019 which involved "Leveraging advanced computer algorithms to explore the potential of AI, big data and deep learning in support of the DoD’s algorithmic warfare mission" and "Bringing major ISPs to the Federal Space on a program with SecDef priority and congressional oversight". Transcripts are available from for-pay services such as LexisNexis. The author thanks investigative journalist Lee Fang for pointing out these transcript quotes. Out of the mentioned companies making use of tax havens, their 2008 effective tax rates, from lowest to heighest, were: Broadcom (5.00%), Genpact (6.14%), Nvidia (11.5%), eBay (18.54%), Dell (23.0%), Microsoft (25.8%), Amazon (27.4%), Alphabet (27.8%), accenture (29.3%), Oracle (29.5%), Apple (31.6%), and Salesforce (50.6%). The only company which paid near or above the 2008 U.S. federal statutory rate of 35% was salesforce, which paid substantially higher (50.6%) due to the volatility of only just having turned a (small) profit before income taxes. Figure 2 also provides the option to filter down to only two-way peering links via the 'reciprocal' analogues of each category. See Figure B from the 2013 report, entitled Corporate tax rates and economic growth since 1947, written by Thomas L. Hungerford of the Economic Policy Institute. While their reported data for the actual tax rates paid by companies (their 'effective tax rate') ends in 2005, it oscillated around 30% from 1991 until that final date. Node positions were determined through thekamada_kawai_layout
force-directed graph layout routine of the python package
networkx.
According to the Pentagon, an
alleged leak
of a letter calling for
a Committee on Foreign Investment in the US
(CFIUS)
review of the Broadcom acquisition of Qualcomm was likely
fake.
Symantec's acquisition of Blue Coat Systems involved the latter
company's management becoming the leadership of Symantec
(including Gregory Clark taking over as CEO).
As a result, Symantec's former CEO, Michael Brown,
became
the director of the Defense Innovation Unit on September 24, 2018.
As of writing, bluecoat.com
still redirects to
broadcom.com.
We urge further caution beyond normalizing entirely from the peers
listed in Figure 2: it would seem more meaningful to normalize using
the total number of peers listed in the company's proxy statement to
the SEC, not the number of peers which
happened to lie within our choice of 71 companies.
The author has been purposefully avoiding using the language of
matrices to describe the peer graph: it would dramatically narrow the
audience despite not providing a qualitative increase in insight.
The peer groupings are largely for purposes of executive compensation
-- which, in many cases, involves geographic factors -- and should not
be taken overly seriously.
The Center for Responsive Politics (aka OpenSecrets) ranked Google as
the top corporate lobbyist for both 2017 and 2018, outranking
Amazon's 2018 spend of $14.4M, Facebook's $12.6M, Microsoft's $9.6M,
and Apple's $6.68M. We note that these amounts correspond to
registered lobbying and do not include more opaque forms of influence,
such as
funding think-tanks.
Google, whose monopoly on search engines and the
associated advertising market is also
being condemned,
reportedly made its own offers for
Twitter
(in 2011) and
Snapchat
(in 2013). Google's own attempt at competing in this space (Google+)
was, after a long decline, finally
shut down
in 2019 after a privacy breach.
This figure repurposed a
d3 example
written by Mike Bostock.
Amazon,
Apple, Facebook, and Alphabet each responded with
criticisms
of the House antitrust report which denied their own
company being a monopoly --
though Apple hinted the criticism was fair of its competitors.
A prominent anti-trust expert, Fiona Scott Morton, is now known to have
been
funded
by Apple and Amazon -- whom she argued should not
be subject to anti-trust enforcement -- while writing policy
'roadmaps' for the Omidyar Network on breaking up
Google
and
Facebook.
Her coauthor, Omidyar Network's Senior Advisor on Beneficial
Technology, David C. Dinielli, later gave a
testimony
entitled 'Stacking the Tech: Has Google harmed competition in online
advertising?'
to the September 15, 2020
Subcommittee
on Antitrust, Competition
Policy, and Consumer Rights of the United States Senate Judiciary
Committee.
The panel also featured corporate lobbyist Carl Szabo of
NetChoice,
whom, incidentally, is funded by both eBay and PayPal, whom Omidyar
Network's namesake respectively co-founded and is a major shareholder
of.
The only arithmetic required to back out reconciliation percentages
from the dollar amounts is knowledge that the dollar amount listed
for the tax provision at the federal statutory rate corresponds to
21%. For example, we arrive at Nvidia's 10.1% effective tax reduction
from tax havens through multiplying the ratio of the 'foreign tax
rate differential' (a benefit of $301M) with the nominal expense
of the federal statutory rate ($624M charge) by the federal
statutory rate (21%): (301M / 624M) * 21% = 10.1%.
Indeed, Google provided so much funding to the New America Foundation
that its main conference room was named the
Eric Schmidt Ideas Lab.
As reported by the New York Times,
in addition to -- because of? -- Google's ample funding, Mr. Schmidt
served as Chairman of New America until 2016.
Relative to the aforementioned companies, Facebook has had a hearty
19% effective tax rate in its last two fiscal years after adjusting for
one-time TCJA impacts. Obviously, this is still below the 21% statutory
rate and even 2% of their roughly $25B pre-tax income for each of the
last two fiscal years sums to roughly $1B. Clearly such savings have an
impact on the ability of Facebook's largest shareholder, Mark Zuckerberg,
to run the
Chan-Zuckerberg Initiative
(CZI). One can also question why, if Bill Gates is doing more than scoring
political points by stating that the current tax system is
'not fair',
he doesn't pressure his own company into at least paying at least near the
U.S. federal statutory rate of 21% -- and ideally as high as the pre-Trump
rate of 35%.